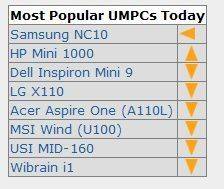
 I’ll be honest with you. I’m not sure what value this has for potential UMPC, Netbook and MID customers but its fun to look at!
It appears on the product overview page (which I’ve recently updated with more data columns and now has over 220 devices in it) and it shows rising and falling popularity relative to the top device. For example, the HP Mini was gaining on the Samsung NC10 when I generated the graph. The graph is updated daily.
One tip: Click on the arrows and you see the last 140 days popularity and how far away the device is from #1 spot.




The scripts for “Products” page doesn’t work currently in Internet Explorer, and it’s over a week now. You can’t see any list with machines.
You should put this on to do list!
Working on this right now.
Thanks for the heads-up.
Steve
Should be fixed now.
Thanks again.
Oooh! i love it. but i was thinking of a color scheme for people with tired eyes =). Like green could be up, red for down, and yellow for the same =)
does that sound ok? o_o
Yeah, why not….
Give me 10 mins.
Steve
Done.
Looking like a Christmas tree but still fun!
Can someone enlighten me as to what statistics this is based on? Click hits or?
Why would not a single EEE be on the list, unless it’s just based on your database clicks?
Hi there I like your post “art now with daily trends. | UMPCPortal – The Mobile Internet and Computing Reference Site” so well that I like to ask you whether I should translate into German and linking back. Answer welcome. Greetings Kroatien