If there’s one thing I love, it’s visualized statistics. Fortunately for me, and anyone else who shares that sentiment, Woot has a nice visual representation of the sales stats of its various products. And seeing how that newfangled HP TouchPad was on sale yesterday, you may be curious to see how it all went down. Let’s have a look:
- First sucker: jasonterhorst (first person to buy the TouchPad)
- Speed to first woot: 6m 54.030s (how long after the deal went up that they pulled the trigger)
- Last wooter to woot: scaevola (last person to buy the TouchPad)
- Last purchase time: 11:59:29 PM Central TimeOrder pace: 2m 21.125s (one TouchPad was sold, on average, every two minutes and 21 seconds)
- Woot wage: $15,839.08 (how much Woot made from the salesWoots sold: 612
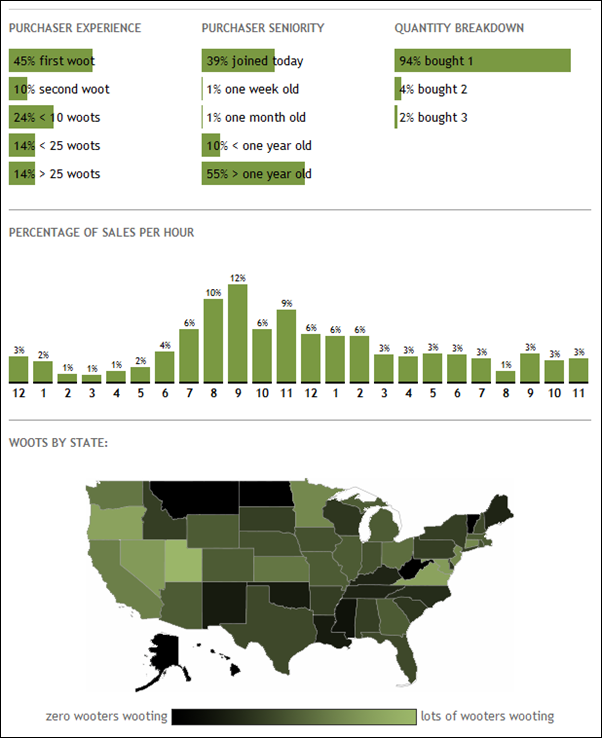
And here are the nice visual bits I promised:
Looks like the coasts are a bit more tablet-friendly than the interior of the country. I wouldn’t have expected it, but it looks like Utah ended up with the most TouchPads, with Virginia following closely behind. We can also see that for 45% of the purchasers, this was their first Woot.
This isn’t a complete picture of the table tendencies of the nation though as our sample size is only 612!





Agree with you that 612 cant get the whole picture of a nation. But this is a great post. keep it up
Replace “Nevada” with “Utah”.
Fixed! Thanks, silly mistake.