In an Intel-led Core M benchmarking meeting today I saw a set of controlled benchmarks from a 6W TDP Core M product. The tests were performed in an 685 gram 12.5-inch Llama Mountain reference tablet with a machined aluminum rear casing that is optimal for this design. We also saw a copper-based rear casing that can handle a lot more thermal energy but you won’t see that happening in consumer products. The benchmark scores we saw were more than I had expected.
Over at Ultrabooknews: Intel Core M Overview, benchmarks and product Previews
Three benchmarks were run, once, on a rested system in a warm room.
Sunspider: 119ms at 2.8 2.6 Ghz. (Surface Pro 3 with Core i5 is 113ms at 2.4Ghz Turbo)
3DMark Icestorm unlimited: 48230
Cinebench R11.5 – 2.65 (Surface Pro 3 with Core i5: 2.77)
Note that these are the scores from a high-end 6W TDP Core M 5Y70. The 4.5W TDP Core M SoCs won’t perform this well and in a product with a less-than-perfect thermal design there could be heat issues that prevent Turbo Boost reaching these high levels.
GPU performance needs to be further tested and long-term gaming could impact Turbo Boost capability.
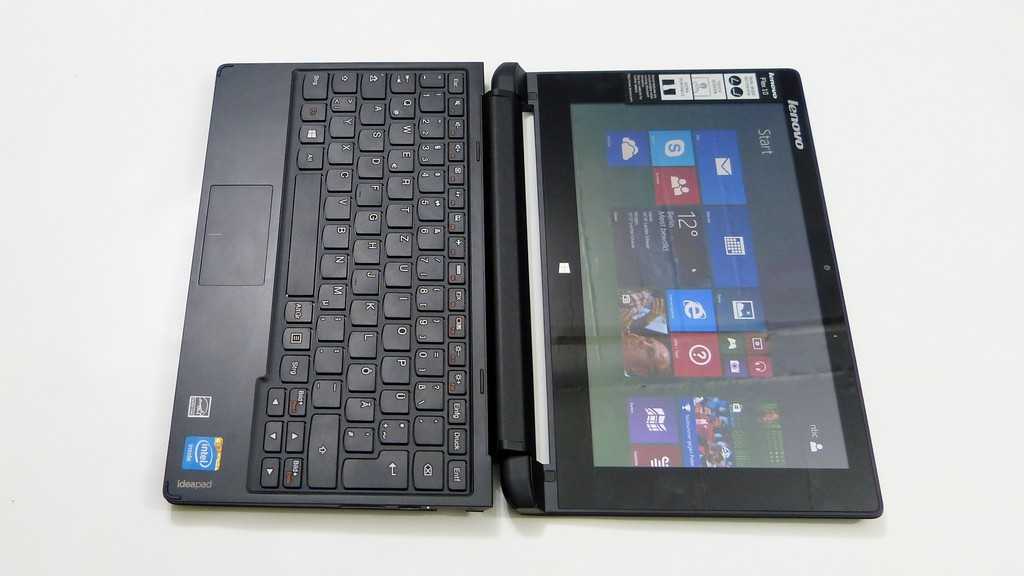
This is the best you’ll see from Core M at 2.8 2.6 Ghz but it’s important to remember that this is best-of-Core M right now. I’m going to be pushing to get the new Lenovo Helix 2 in for testing so at that point we’ll get our first real-product results.
Tip: Check out the Surface Pro 3 review at Notebookcheck.net for a controlled set of performance figures.
Disclaimer: Intel have paid for my attendance at IDF this year.

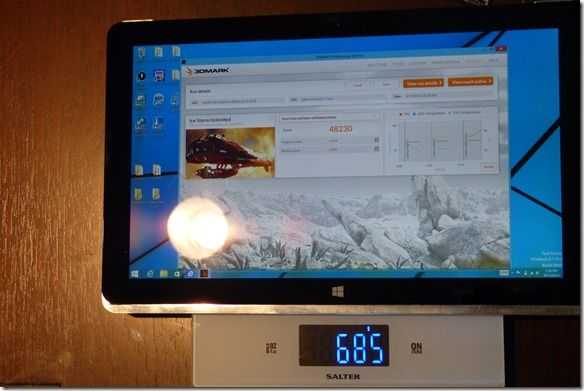
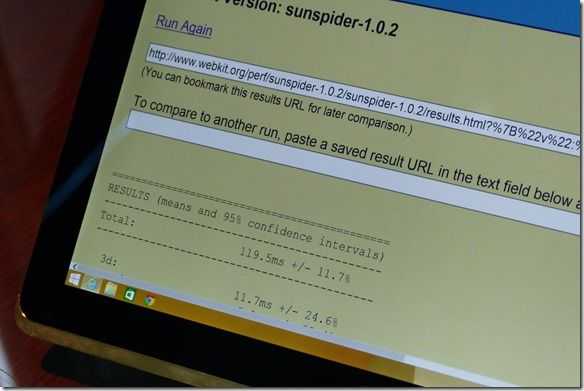
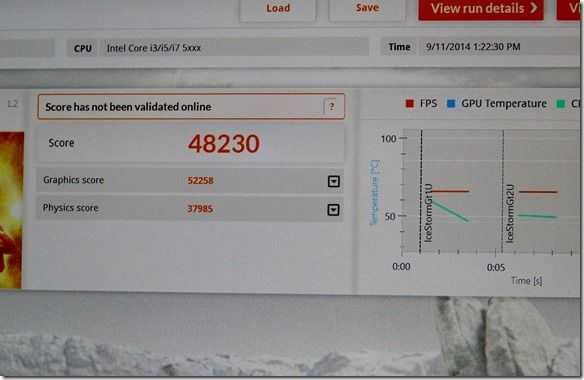
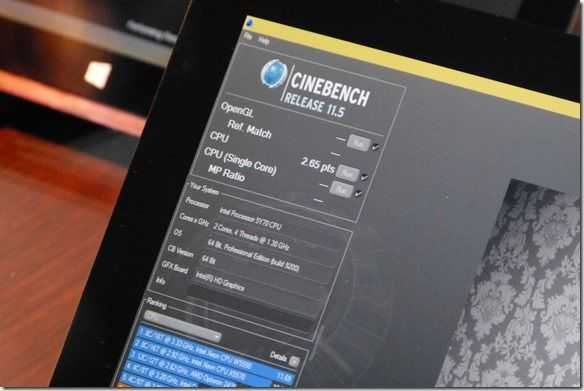



“Note that these are the scores from a high-end 6W TDP Core M 5Y70. The 4.5W TDP Core M SoCs won’t perform this well and in a product with a less-than-perfect thermal design”
I highly doubt it was set at 6W. The nominal TDP for the 5Y70 is 4.5W, exactly the same as the rest. Though the cTDPup 6W exist, according to that graph about TDP and device thickness, Llama Mountain would have hard time dissipating 4.5W, let alone 6W.
“GPU performance needs to be further tested and long-term gaming could impact Turbo Boost capability.”
That’s exactly the point of this CPU. Extended CPU AND GPU intensive sessions would be done on a 15W SoC. Core M’s 4.5W is good for doing EITHER, whether CPU-only or GPU-only.
“Sunspider: 119ms at 2.8 Ghz.”
Two points you want to consider.
1. The MAX Turbo of 5Y70 is 2.6GHz. Unless there’s some hidden figure they are not telling us
2. The reference platform is using INTERNET EXPLORER, which is significantly faster than Chrome in Sunspider Javascript but slower in everything else. I am betting that 5Y70 will end up minutely slower than Core i5 4200U in Surface Pro 2.
Sorry. I hadn’t seen that the Sunspider test was done under IE.
The Surface Pro 3 in front of me (Core i5) returns 113ms.
As for the TDP it is definitely a 6W TDP configured part.
As for the clockrate, yes, that was a max 2.6Ghz.
In terms of CPU model number, it was definitely a 5Y70
The tablets aluminium rear casing was quoted as capable of handling up to 7.5W TDP and the copper-cased demonstrator we saw was capable of handling a 12W TDP set-up.
So sorry for the clockrate and IE test error. Adjusting the article right now…
Just to confirm. This was Llama mountain with different casings. The pressed alluminium case you usually see on these designs would be able to handle 4.5W TDP. Machined alluminium 6-7.5W (due to better crystal alignment apparently) and the copper-backed casing could handle up to 12W.
With 50% of the performance of Core M dependent on Turbo Boost/thermal design there’s going to be a lot of variation in end-product performance. There’s no single Core M performance figure, only (Core M + product) performance figures.
So there’s another review with the 5Y70 scoring 2.48 in Cinebench. I think that might be a 4.5W TDP score. Sunspider scores 143ms with IE as well.
The 5Y10a on the Lenovo Helix 2 gets 194ms, which makes the 5Y70 35% faster. Sunspider scales linearly so 5Y70 on a Helix 2 should get 150ms. That makes Surface Pro 3 30% faster than the 5Y70.
That’s still pretty fast. It seems though one might call that “shady” benchmarking.
Chippy this article is really sloppy. Most of my points are what david said– primarily that you’re reporting IE times with the Core M and Chrome times with the SP3. Also it’s probably 4.5W.. and definitely 2.6ghz! How long was the 3D mark test ran for?
Could we please have a CPU benchmark. The ones above seem to be mainly around GPU.
I’d like to see XZ (de)compression tests. That’s the most CPU intensive task I do on notebooks.
I thought Sunspider is considered a not so reliable test. Then again most companies can tune their software and hardware to do well on specific benchmarks and real world anecdotal type tests actually provide more reliable results.
I prefer to see benchmarks using specific, actually useful, tasks. For example, as mentioned, file compression/decompression (I personally use Pixz for multi-threaded compression/decompression), video encode/decode (both HW and SW), encryption/decryption (ie. SSL, SSH, FDE, HW/SW, etc.), etc. Power consumption graphs during these loads would be nice too. These things can be easily scripted under Linux. Not sure about Windows. It seems you’d have to do it manually or write custom applications. Maybe PowerShell provides scriptable hooks into running things and tracking CPU frequency, resource and power usage.